The iris dataset is perhaps one of the most famous datasets used to learn and teach statistics and now machine learning. Being curious about this dataset lead me last time to the TableConvert.com web site that I discussed in my previous post here (and there.)
“Metro Maps”
Today while revisiting the Wikipedia link for this dataset (Iris_flower_data_set) my eyes caught a image inset with an intriguing caption: “An example of the so-called “metro map” for the Iris data set.” and indeed this looked like the Paris, London, Boston… metro map (or perhaps Washington DC..) But indeed it was about the Iris flower dataset.
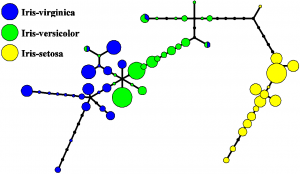
An example of the so-called “metro map” for the classical Iris flower data set (by A. N. Gorban, A. Zinovyev. 2012, Wikipedia commons)
This seemed like a cool representation and was there a software to accomplish that? Perhaps it could be useful in Next Gen Sequencing data analysis?
More search led me to some papers dating from the last decade (2007 or so) and applied to microarray data. I first discovered this poster with that same image:
Branching principal components: elastic graphs, topological grammars and metro maps [link – archived]
Alexander Gorban(1,3), Neil Sumner(1) , Andrei Zinovyev(2,3)
(1)University of Leicester, Leicester, UK (2)Institut Curie, Paris, France (3)Institute of Computational Modeling SB RAS, Krasnoyarsk, Russia
The paper (Gorban et al. 2007) by the same authors provide more details and unfortunately no software provided in R, python or anything else. That’s too bad!
But looking back within the “Wikipedia Commons” page of the image there was another reference (Gorban & Zinovyev, 2010) into which there is a paragraph with a link for a software library:
The elastic map algorithm is extremely fast at the optimisation step due to the simplest form of the smoothness penalty. It is implemented in several programming languages as software libraries or front- end user graphical interfaces freely available from the web-site http://bioinfo.curie.fr/projects/vidaexpert.
On that link there is indeed a software (Windows only that as a very “old Windows 98 look”) and still at version 1.0. The screen shots do not show a Metro map and I can’t tell if that software could even make one.
There is a tutorial: detailed video tutorial, in Russian language: (zipped file , 500M).
Clusering components
I also stumbled on this article from the STHDA (Statistical tools for high-throughput data analysis): HCPC – Hierarchical Clustering on Principal Components: Essentials which is a chapter in a series or articles in a book: Articles – Principal Component Methods in R: Practical Guide
Interestingly the web site is bilingual English/French and has videos both in French (native) and English (French accent) but is presented as a “course” and may be quite useful.
There are many other actual online subjects, for example “R Graphics Essentials” or “Linear Regression Essentials in R” and many more.
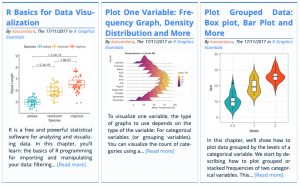
R Graphics Essentials chapter samples
REFERENCES
Gorban A., Summer N. R. , Zinovyev A. Y., 2007 Beyond The Concept of Manifolds: Principal Trees, Metro Maps, and Elastic Cubic Complexes – arXiv:0801.0176v1 [physics.data-an] (later published in book: Principal Manifolds for Data Visualization and Dimension Reduction, Lecture Notes in Computational Science and Engineering 58, Springer, Berlin – Heidelberg, 2008, 219-237 – 10.1007/978-3-540-73750-6_9)
A. N. Gorban, A. Zinovyev. Principal manifolds and graphs in practice: from molecular biology to dynamical systems, International Journal of Neural Systems, Vol. 20, No. 3 (2010) 219–232.